| % of Americans that rate their healthcare coverage as ... Excellent/Good | Fair | Poor | |
|---|---|---|---|
| 2001 | 68 | 20 | 6 |
| 2002 | 71 | 17 | 7 |
| 2003 | 66 | 23 | 6 |
| 2004 | 69 | 20 | 7 |
| 2005 | 63 | 21 | 11 |
| 2006 | 65 | 23 | 8 |
| 2007 | 70 | 15 | 8 |
| 2008 | 67 | 19 | 8 |
| 2009 | 69 | 17 | 10 |
| 2010 | 71 | 16 | 9 |
| 2011 | 72 | 14 | 11 |
| 2012 | 67 | 17 | 10 |
| 2013 | 69 | 17 | 10 |
| 2014 | 67 | 21 | 9 |
Sources:
gallup.com

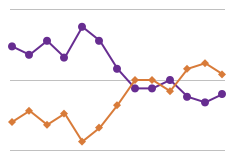
So far, according to Americans, the Affordable Care Act has not changed much. The public's perception of their personal healthcare coverage has remained relatively constant since 2001, with about two thirds of health care recipients claiming they receive excellent or good care.