Voters in the 2014 Congressional Race by Ethnicity
by Liam Duffy on Nov 9, 2014 | Views: 238 | Score: 0
| Latino | White | Black | |
|---|---|---|---|
| Democrat | 62 | 38 | 89 |
| Republican | 36 | 60 | 10 |
| Other | 2 | 2 | 1 |
Percent of Voters
Sources:
pewhispanic.org
Share:


| Latino | White | Black | |
|---|---|---|---|
| Democrat | 62 | 38 | 89 |
| Republican | 36 | 60 | 10 |
| Other | 2 | 2 | 1 |
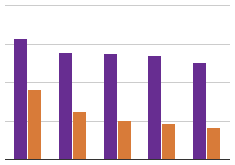

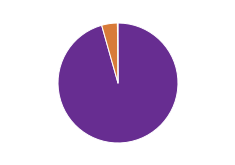
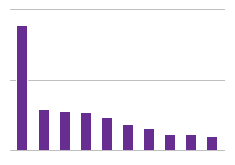
This chart shows the distribution of political party affiliation as measured by a self-report survey from the Pew Research Center concerning the recent vote for congress representatives. Those who self-identified as Black were 89% likely to claim that they had voted for a democrat, compared to only 38% of White respondents. Clearly, race is at least a mild predictor of political ideology.
Quite a few of the Blacks I know do not feel free at ALL to say they vote Republican!
If that is the case, then it is quite a shame really. While I do believe that such a fear to express their true political beliefs is a failure of society, it may also be a significant criticism of the Republican party itself. Maybe it's the policies, the image, or the message, but whatever it may be, the Republicans are simply not resonating with minorities.