| Favor allowing gays/lesbians to marry legally | Oppose allowing gays/lesbians to marry legally | |
|---|---|---|
| Northeast | 55 | 33 |
| West | 52 | 32 |
| Midwest | 51 | 36 |
| South | 31 | 56 |
Among Americans
%
Sources:
today.yougov.com
Share:


| Favor allowing gays/lesbians to marry legally | Oppose allowing gays/lesbians to marry legally | |
|---|---|---|
| Northeast | 55 | 33 |
| West | 52 | 32 |
| Midwest | 51 | 36 |
| South | 31 | 56 |

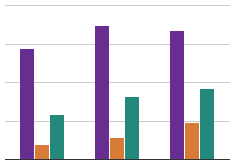
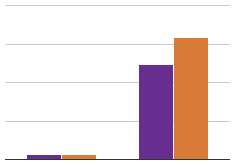
While most regions of the country have recently seen majority-levels of support for legal gay marriage, the South holds on tenaciously to the opposing stance. Only 31% of people in the South support legalizing homosexual marriage, a rate of 24 percentage points less than the Northeast, 21 less than the West and 20 less than the Midwest.