“ozone” Charts
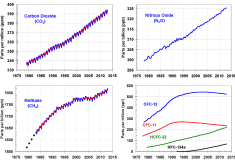
Greenhouse Gases Remain At High Levels »
Global carbon dioxide, nitrous oxide, and methane levels have continued to increase during the last 30 years. CFC-12 and CFC-11…
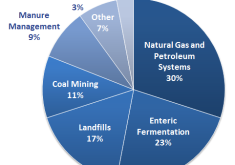
Livestock Flatulence is a Major Methane Source »
Enteric fermentation (part of the digestive process of livestock) is responsible for a whopping 23% of U.S. methane emissions. Manure…
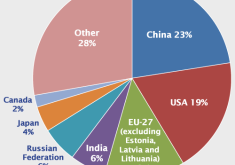
Global CO2 Emissions by Country »
There were 8,742 million metric tons of total global carbon dioxide (CO2) emissions in 2008. China was the largest contributor…
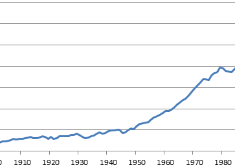
Increase in Global CO2 Emissions 1900-2008 »
Global carbon dioxide (CO2) emissions from fossil-fuels have increased from about 2,500 teragrams of CO2 in 1900 to 32,000 teragrams…
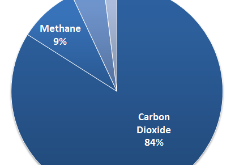
U.S. Greenhouse Gas Emissions by Gas Type »
The U.S. greenhouse gas emissions totaled 6,702 million metric tons of CO2 equivalent in 2011. The majority of emissions were…
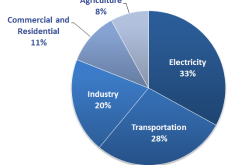
U.S. Greenhouse Gas Emissions by Economic Sector »
In total there were 6,702 million metric tons of U.S. greenhouse gas emissions in 2011. The plurality of greenhouse gas…
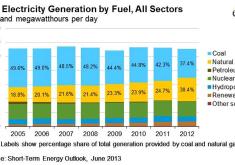
U.S. Electricity Generation by Fuel Type »
The U.S. is relying more on natural gas and less on coal to generate electricity. In 2005, 49.6% of electricity…

