“federal-budget” Charts
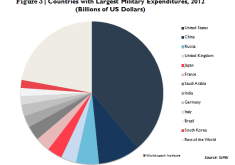
US Takes Biggest Piece of Military Spending Pie »
The United States designated $682.5 billion to military expenditures in 2012, nearly level with the $683.4 spent by the 11…
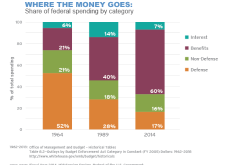
Where the Money Goes: Share of Federal Spending by Category »
The federal government spends a lot of money: $3.5 trillion this year. Two-thirds goes to pay for benefits programs, including…
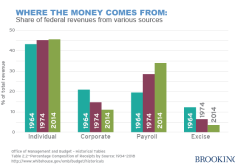
Share of Federal Revenues from Various Sources »
This year, about 46% of all revenues come from the individual income tax, 34% from the Social Security/Medicare payroll tax…
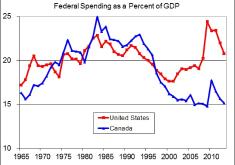
Federal Government: Much Smaller in Canada »
Canadian federal spending fell to 15.1 percent of GDP in 2013 and is projected to decline to 14.0 percent by…
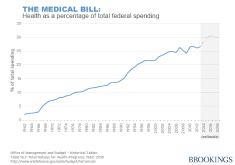
Health as a Percentage of Total Federal Spending »
In 1962, before Medicare and Medicaid got going, overall health spending (Medicare, Medicaid, VA, government employees health insurance, etc.) amounted…
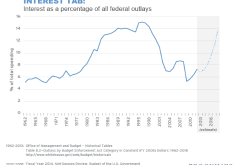
Interest as a Percentage of All Federal Outlays »
There are two reasons that interest rates represents a growing slice of the federal budget: (1) As long as the…
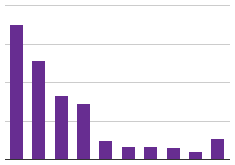
Hourly Spending Distribution on US Military Weapons »
Every hour 3.2 million dollars of tax payer money is spent on nuclear weapons, jet fighters, and cruise missiles. 2.2…
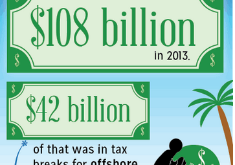
3 Outrageous Numbers On Corporate Tax Breaks »
All Americans benefit from public goods like clean air and water, infrastructure, education and other federal programs. These goods are…
Where Your 2012 Taxes Went »
On April 15, 2013, millions of Americans filed their income taxes for 2012. This chart shows how each one of…
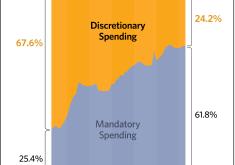
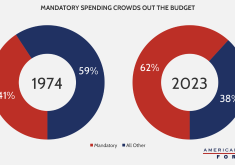
Mandatory Spending Is Crowding Out The Budget »
Mandatory spending - federal appropriations on 'autopilot' - has been on a steady march to take over the budget, rising…
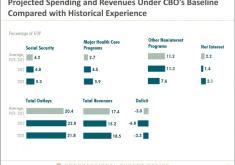
Fundamental budget challenge: Paying for the baby boomers »
Budget chief Douglas Elmendorf says the fundamental federal budgetary challenge is due to federal programs becoming much more expensive because…

