
Oil and shortening are now American's preferred fats
by Stephen Ostermiller on Jun 23, 2014 | Views: 392 | Score: 4
| Lard | Tallow | Margarine | Shortening | Salad, cooking, and other oil | Butter | |
|---|---|---|---|---|---|---|
| 1909 | 6.9 | 0 | 1.2 | 8 | 1.5 | 17.9 |
| 1910 | 8.2 | 0 | 1.6 | 8 | 1.5 | 18.4 |
| 1911 | 5.6 | 0 | 1.1 | 8 | 1.5 | 18.7 |
| 1912 | 11.2 | 0 | 1.5 | 8.3 | 1.2 | 16.6 |
| 1913 | 10.7 | 0 | 1.4 | 9.5 | 1.9 | 16.5 |
| 1914 | 10.6 | 0 | 1.4 | 10.8 | 3.8 | 17 |
| 1915 | 11.5 | 0 | 1.4 | 10 | 3.1 | 17.2 |
| 1916 | 11.6 | 0 | 1.8 | 9.5 | 2 | 17.3 |
| 1917 | 10 | 0 | 2.7 | 10.8 | 0.9 | 15.8 |
| 1918 | 11.9 | 0 | 3.3 | 10.5 | 3.7 | 14.2 |
| 1919 | 10.7 | 0 | 3.4 | 11.7 | 2.4 | 15.3 |
| 1920 | 12 | 0 | 3.4 | 7.6 | 1.8 | 14.9 |
| 1921 | 10.8 | 0 | 2 | 7 | 3.5 | 16.3 |
| 1922 | 13.3 | 0 | 1.7 | 6.7 | 4.4 | 17.1 |
| 1923 | 14.3 | 0 | 2 | 6.6 | 3.9 | 17.9 |
| 1924 | 14.2 | 0 | 2 | 7 | 4.3 | 18.1 |
| 1925 | 12.3 | 0 | 2 | 9.7 | 4.8 | 18.3 |
| 1926 | 12.2 | 0 | 2 | 9.5 | 5.6 | 18.3 |
| 1927 | 12.7 | 0 | 2.3 | 9.7 | 4.9 | 17.6 |
| 1928 | 13.2 | 0 | 2.6 | 9.3 | 5 | 17.6 |
| 1929 | 12.7 | 0 | 2.9 | 9.9 | 5.6 | 17.6 |
| 1930 | 12.7 | 0 | 2.6 | 9.8 | 4.9 | 18.3 |
| 1931 | 13.6 | 0 | 1.9 | 9.4 | 5.1 | 18.3 |
| 1932 | 14.4 | 0 | 1.6 | 7.5 | 5.6 | 18.5 |
| 1933 | 14 | 0 | 1.9 | 7.5 | 6.2 | 18.1 |
| 1934 | 13 | 0 | 2.1 | 9.5 | 5.4 | 18.5 |
| 1935 | 9.6 | 0 | 3 | 12 | 5.9 | 17.5 |
| 1936 | 11.2 | 0 | 3.1 | 12.3 | 6 | 16.8 |
| 1937 | 10.5 | 0 | 3.1 | 12.3 | 6.6 | 16.7 |
| 1938 | 11.1 | 0 | 3 | 11.5 | 6.9 | 16.6 |
| 1939 | 12.7 | 0 | 2.3 | 10.7 | 7.2 | 17.4 |
| 1940 | 14.4 | 0 | 2.4 | 9 | 7.4 | 17 |
| 1941 | 13.8 | 0 | 2.7 | 10.5 | 8.2 | 16.4 |
| 1942 | 12.9 | 0 | 2.9 | 9.6 | 7.6 | 16.4 |
| 1943 | 12.7 | 0 | 3.7 | 9.8 | 6.7 | 13.1 |
| 1944 | 12.6 | 0 | 3.6 | 9.8 | 6.9 | 13.4 |
| 1945 | 12.2 | 0 | 3.9 | 10 | 6.2 | 11.7 |
| 1946 | 11.7 | 0 | 3.8 | 10.1 | 6.4 | 10.7 |
| 1947 | 12.7 | 0 | 5 | 9.3 | 6.9 | 11.3 |
| 1948 | 13 | 0 | 6.1 | 9.7 | 7.1 | 10.1 |
| 1949 | 12 | 0 | 5.7 | 9.7 | 7.9 | 10.6 |
| 1950 | 12.6 | 0 | 6.1 | 11 | 8.6 | 10.9 |
| 1951 | 12.3 | 0 | 5.7 | 9 | 7.7 | 9.7 |
| 1952 | 11.6 | 0 | 6.1 | 10.2 | 8.7 | 8.6 |
| 1953 | 11.1 | 0 | 6.7 | 10.4 | 9.1 | 8.6 |
| 1954 | 10 | 0 | 8.1 | 11.8 | 9.5 | 9.1 |
| 1955 | 9.9 | 0 | 8.1 | 11.6 | 10.5 | 9.3 |
| 1956 | 9.7 | 0 | 8.3 | 11 | 10.9 | 9 |
| 1957 | 9.3 | 0 | 8.5 | 10.5 | 10.8 | 8.5 |
| 1958 | 9.4 | 0 | 8.9 | 11.3 | 10.5 | 8.4 |
| 1959 | 8.7 | 0 | 9.1 | 12.6 | 11.2 | 8 |
| 1960 | 7.4 | 0 | 9.3 | 12.6 | 11.5 | 7.7 |
| 1961 | 7.5 | 0 | 9.3 | 12.9 | 11.2 | 7.5 |
| 1962 | 7 | 0 | 9.2 | 13.4 | 11.7 | 7.5 |
| 1963 | 6.2 | 0 | 9.4 | 13.5 | 13.2 | 7.1 |
| 1964 | 6.2 | 0 | 9.6 | 13.8 | 14.2 | 7.1 |
| 1965 | 6.2 | 0 | 9.8 | 14.2 | 14.1 | 6.6 |
| 1966 | 5.3 | 0 | 10.6 | 16 | 15.1 | 5.8 |
| 1967 | 5.2 | 0 | 10.5 | 15.9 | 15.1 | 5.6 |
| 1968 | 5.4 | 0 | 10.7 | 16.3 | 15.9 | 5.4 |
| 1969 | 4.9 | 0 | 10.7 | 17 | 16.4 | 5.2 |
| 1970 | 4.5 | 0 | 10.8 | 17.3 | 17.7 | 5 |
| 1971 | 4.1 | 0 | 10.9 | 16.8 | 17.9 | 4.8 |
| 1972 | 3.5 | 0 | 11.1 | 17.6 | 19.1 | 4.5 |
| 1973 | 3.2 | 0 | 11.1 | 17.1 | 20.3 | 4.7 |
| 1974 | 3 | 0 | 11.1 | 16.9 | 20.4 | 4.3 |
| 1975 | 3 | 0 | 11 | 16.9 | 19.9 | 4.7 |
| 1976 | 2.7 | 0 | 11.9 | 17.6 | 21.9 | 4.3 |
| 1977 | 2.3 | 0 | 11.4 | 17.2 | 21 | 4.3 |
| 1978 | 2.2 | 0 | 11.3 | 18 | 22.1 | 4.4 |
| 1979 | 2.3 | 0.4 | 11.2 | 18.4 | 22.6 | 4.5 |
| 1980 | 2.3 | 1.1 | 11.3 | 18.2 | 22.7 | 4.5 |
| 1981 | 2.2 | 1 | 11.1 | 18.5 | 23.2 | 4.2 |
| 1982 | 2.3 | 1.3 | 11 | 18.6 | 23.5 | 4.3 |
| 1983 | 1.7 | 2.1 | 10.4 | 18.5 | 25.2 | 4.9 |
| 1984 | 1.9 | 1.7 | 10.4 | 21.3 | 24.2 | 4.9 |
| 1985 | 1.6 | 2 | 10.8 | 22.9 | 25.1 | 4.9 |
| 1986 | 1.5 | 1.8 | 11.4 | 22.1 | 26.1 | 4.6 |
| 1987 | 1.6 | 0.9 | 10.5 | 21.4 | 26.9 | 4.7 |
| 1988 | 1.5 | 0.8 | 10.3 | 21.5 | 27.6 | 4.5 |
| 1989 | 1.2 | 0.3 | 10.2 | 21.5 | 25.6 | 4.4 |
| 1990 | 0.9 | 0.6 | 10.9 | 22.2 | 26.4 | 4.4 |
| 1991 | 0.7 | 1.4 | 10.5 | 22.3 | 27.6 | 4.3 |
| 1992 | 0.4 | 2.4 | 10.9 | 22.3 | 28.4 | 4.3 |
| 1993 | 0.4 | 2.2 | 11 | 24.9 | 28.3 | 4.6 |
| 1994 | 0.7 | 2.4 | 9.8 | 23.9 | 27.5 | 4.8 |
| 1995 | 0.4 | 2.7 | 9.1 | 22.2 | 28.5 | 4.4 |
| 1996 | 0.6 | 2.9 | 9 | 21.9 | 28.3 | 4.3 |
| 1997 | 0.8 | 2.1 | 8.4 | 20.5 | 30.3 | 4.1 |
| 1998 | 0.7 | 3.1 | 8.2 | 20.5 | 29.7 | 4.4 |
| 1999 | 0.7 | 3.6 | 7.9 | 21.1 | 31.3 | 4.7 |
| 2000 | 0.8 | 4 | 7.5 | 31.6 | 36.3 | 5.52 |
| 2001 | 1.1 | 3.1 | 7 | 32.6 | 38 | 4.43 |
| 2002 | 1.3 | 3.4 | 6.5 | 33.3 | 41.8 | 4.45 |
| 2003 | 1.3 | 3.8 | 5.3 | 32.8 | 42.3 | 4.48 |
| 2004 | 0.7 | 4 | 5.3 | 32.6 | 42.3 | 4.54 |
pounds per capita
Sources:
future.aae.wisc.edu
Share:

 of
of


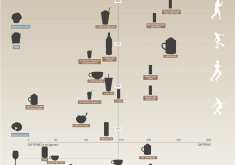
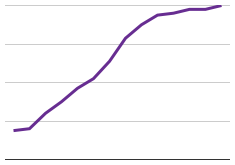

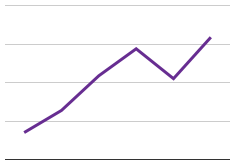
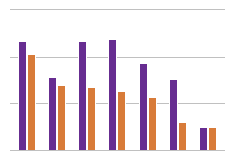
Americans source of fat has drastically changed in the last 100 years. Butter and Lard are eaten less, while salad oil, cooking oil, and shortening are consumed more. Margarine usage rose mid-century, but usage has since declined again. The total fat consumption per capita is way up.