
| US's Debt to GDP Ratio | |
|---|---|
| 1929 | 16 |
| 1930 | 18 |
| 1931 | 22 |
| 1932 | 33 |
| 1933 | 39 |
| 1934 | 40 |
| 1935 | 39 |
| 1936 | 40 |
| 1937 | 39 |
| 1938 | 43 |
| 1939 | 43 |
| 1940 | 42 |
| 1941 | 38 |
| 1942 | 44 |
| 1943 | 67 |
| 1944 | 89 |
| 1945 | 116 |
| 1946 | 113 |
| 1947 | 103 |
| 1948 | 90 |
| 1949 | 92 |
| 1950 | 83 |
| 1951 | 73 |
| 1952 | 70 |
| 1953 | 68 |
| 1954 | 69 |
| 1955 | 64 |
| 1956 | 60 |
| 1957 | 56 |
| 1958 | 57 |
| 1959 | 54 |
| 1960 | 52 |
| 1961 | 51 |
| 1962 | 49 |
| 1963 | 47 |
| 1964 | 45 |
| 1965 | 42 |
| 1966 | 39 |
| 1967 | 38 |
| 1968 | 36 |
| 1969 | 34 |
| 1970 | 34 |
| 1971 | 34 |
| 1972 | 33 |
| 1973 | 32 |
| 1974 | 30 |
| 1975 | 31 |
| 1976 | 33 |
| 1977 | 33 |
| 1978 | 32 |
| 1979 | 31 |
| 1980 | 32 |
| 1981 | 31 |
| 1982 | 34 |
| 1983 | 37 |
| 1984 | 38 |
| 1985 | 42 |
| 1986 | 46 |
| 1987 | 48 |
| 1988 | 49 |
| 1989 | 50 |
| 1990 | 54 |
| 1991 | 59 |
| 1992 | 62 |
| 1993 | 64 |
| 1994 | 64 |
| 1995 | 65 |
| 1996 | 64 |
| 1997 | 62 |
| 1998 | 60 |
| 1999 | 58 |
| 2000 | 55 |
| 2001 | 55 |
| 2002 | 56 |
| 2003 | 58 |
| 2004 | 60 |
| 2005 | 60 |
| 2006 | 61 |
| 2007 | 62 |
| 2008 | 68 |
| 2009 | 83 |
| 2010 | 90 |
| 2011 | 95 |
| 2012 | 99 |
| 2013 | 99 |
| 2014 | 101 |
%
Sources:
useconomy.about.com
Share:

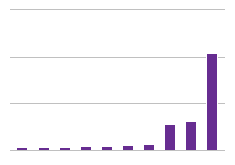


By the start of 2015, America's total national debt exceeded 18 trillion dollars, and it continues to grow by billions each day. These nominal values can be somewhat misleading, however, as they fail to take the size of the American economy into perspective. The debt to GDP ratio compensates for this issue by comparing the total US debt to America's total economic output throughout a year. 2014 was a historic year because for the first time since WWII, America's debt has exceeded 100% of its GDP.