
Voter Turnout in Non-Presidential Elections By Gender
by Kaitlin Senk on Jul 19, 2013 | Views: 159 | Score: 2
| Women | Men | |
|---|---|---|
| 1966 | 53 | 58.2 |
| 1970 | 52.7 | 56.8 |
| 1974 | 43.4 | 46.2 |
| 1978 | 45.3 | 46.6 |
| 1982 | 48.4 | 48.7 |
| 1986 | 46.1 | 45.8 |
| 1990 | 45.4 | 44.6 |
| 1994 | 45.3 | 44.7 |
| 1998 | 42.4 | 41.4 |
| 2002 | 43 | 41.4 |
| 2006 | 48.6 | 46.9 |
| 2010 | 46.2 | 44.8 |
% of Eligible Voters Who Voted
Sources:
cawp.rutgers.edu
Share:

 of
of

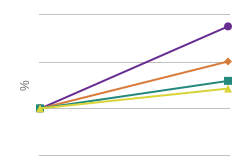
Since 1986, women have had higher voter turnout rates than men at non-presidential elections. Despite higher turnouts rates, women still remain underrepresented in the legislature, state legislatures and state executive offices.