| Republicans | Independents | Democrats | |
|---|---|---|---|
| 2001 | 7 | 16 | 17 |
| 2002 | 8 | 10 | 17 |
| 2003 | 8 | 17 | 14 |
| 2004 | 7 | 17 | 21 |
| 2005 | 9 | 20 | 19 |
| 2006 | 8 | 19 | 20 |
| 2007 | 9 | 17 | 19 |
| 2008 | 12 | 21 | 19 |
| 2009 | 11 | 15 | 15 |
| 2010 | 13 | 17 | 22 |
| 2011 | 15 | 20 | 21 |
| 2012 | 16 | 20 | 26 |
| 2013 | 16 | 22 | 29 |
Sources:
gallup.com
Share:


| Republicans | Independents | Democrats | |
|---|---|---|---|
| 2001 | 7 | 16 | 17 |
| 2002 | 8 | 10 | 17 |
| 2003 | 8 | 17 | 14 |
| 2004 | 7 | 17 | 21 |
| 2005 | 9 | 20 | 19 |
| 2006 | 8 | 19 | 20 |
| 2007 | 9 | 17 | 19 |
| 2008 | 12 | 21 | 19 |
| 2009 | 11 | 15 | 15 |
| 2010 | 13 | 17 | 22 |
| 2011 | 15 | 20 | 21 |
| 2012 | 16 | 20 | 26 |
| 2013 | 16 | 22 | 29 |
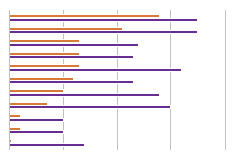
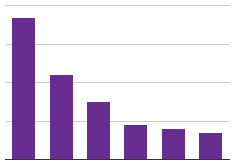
Both Independents and Democrats reached new record highs for the percentage within each affiliation that are of the opinion that current immigration levels should increase. Republicans, too, reached a record high in 2012 of 16%, a figure that was matched in 2013.