Who Runs for Office in America? By Education
by Peter Graham on Sep 12, 2014 | Views: 147 | Score: 3
| Share of general population | Share of those who run for public office | |
|---|---|---|
| High School or less | 42 | 19 |
| Some college | 31 | 36 |
| College grad | 17 | 29 |
| Post grad | 10 | 16 |
Among Americans
%
Sources:
pewresearch.org

 of
of

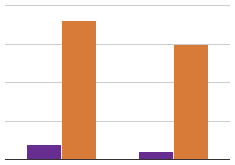
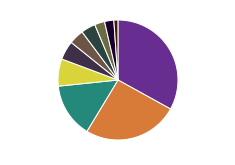
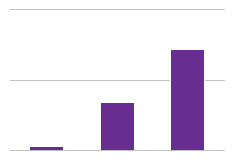
Those who have attended higher education and finished at least some undergraduate study disproportionately run for public office at higher rates than the 42% of Americans that have only a high school education or less.