| World | United States | European Union | China | Russian Federation | |
|---|---|---|---|---|---|
| 2004 | 4.2 | 3.8 | 2.6 | 10.1 | 7.2 |
| 2005 | 3.6 | 3.4 | 2.2 | 11.3 | 6.4 |
| 2006 | 4.1 | 2.7 | 3.4 | 12.7 | 8.2 |
| 2007 | 4 | 1.8 | 3.2 | 14.2 | 8.5 |
| 2008 | 1.5 | -0.3 | 0.4 | 9.6 | 5.2 |
| 2009 | -2.1 | -2.8 | -4.5 | 9.2 | -7.8 |
| 2010 | 4.1 | 2.5 | 2 | 10.4 | 4.5 |
| 2011 | 2.8 | 1.8 | 1.6 | 9.3 | 4.3 |
| 2012 | 2.4 | 2.8 | -0.4 | 7.7 | 3.4 |
| 2013 | 2.2 | 1.9 | 0.1 | 7.7 | 1.3 |
% Annual GDP Growth
Sources:
data.worldbank.org, fas.org

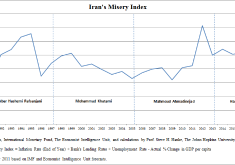
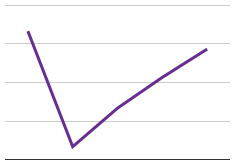
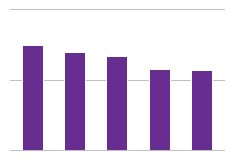
An estimated $1,250 billion was spent by the U.S. on Iraq and Afghanistan operations alone. Most major economic regions experienced diminishing growth heading towards the 2008 housing crisis, while everyone was adversely affected between 2007-2009. The world achieved pre-crisis growth immediately in 2010, but we're seeing declining growth once again. China continues to experience relatively sizable growth.