Signup Login
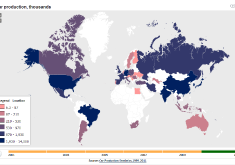
Explore the interactive map of car production worldwide through the first 10 years of 2000s.