| workers under age 25 | all workers | |
|---|---|---|
| 1970 | 9.3 | 3.9 |
| 1971 | 12.6 | 5.9 |
| 1972 | 12.7 | 5.8 |
| 1973 | 10.2 | 4.9 |
| 1974 | 10.8 | 5.1 |
| 1975 | 15.1 | 8.1 |
| 1976 | 15.4 | 7.9 |
| 1977 | 14.3 | 7.5 |
| 1978 | 12.9 | 6.4 |
| 1979 | 11.6 | 5.9 |
| 1980 | 12.6 | 6.3 |
| 1981 | 14.5 | 7.5 |
| 1982 | 16.5 | 8.6 |
| 1983 | 18.5 | 10.4 |
| 1984 | 14.8 | 8 |
| 1985 | 13.6 | 7.3 |
| 1986 | 13 | 6.7 |
| 1987 | 13 | 6.6 |
| 1988 | 11.5 | 5.7 |
| 1989 | 11.8 | 5.4 |
| 1990 | 10.8 | 5.4 |
| 1991 | 12.6 | 6.4 |
| 1992 | 13.9 | 7.3 |
| 1993 | 14 | 7.3 |
| 1994 | 13.4 | 6.6 |
| 1995 | 11.4 | 5.6 |
| 1996 | 12.8 | 5.6 |
| 1997 | 12.2 | 5.3 |
| 1998 | 10.9 | 4.6 |
| 1999 | 10.2 | 4.3 |
| 2000 | 9.4 | 4 |
| 2001 | 9.6 | 4.2 |
| 2002 | 12.1 | 5.7 |
| 2003 | 12 | 5.8 |
| 2004 | 12 | 5.7 |
| 2005 | 11.6 | 5.3 |
| 2006 | 10.4 | 4.7 |
| 2007 | 10.3 | 4.6 |
| 2008 | 11.7 | 5 |
| 2009 | 15 | 7.8 |
| 2010 | 18.8 | 9.7 |
| 2011 | 18.1 | 9.1 |
| 2012 | 16 | 8.2 |
| 2013 | 16.8 | 7.9 |
| 2014 | 14.2 | 6.6 |
unemployment rate
%
Sources:
epi.org

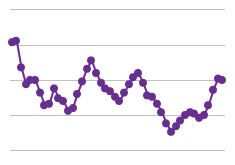
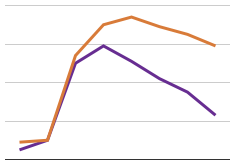
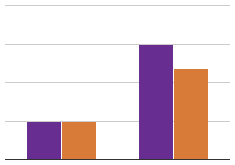
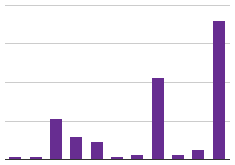
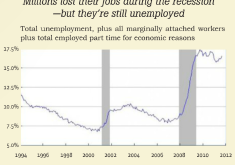
In good times and bad, young workers experience an unemployment rate that is about twice that of all workers. "Unemployment of young workers is extremely high today not because of something unique about the Great Recession and its aftermath that has affected young people in particular... it is high because young workers always experience disproportionate increases in unemployment during downturns."