
| 1 | |
|---|---|
| 1970 | 22.4 |
| 1971 | 22.4 |
| 1972 | 21.7 |
| 1973 | 21.3 |
| 1974 | 20.8 |
| 1975 | 20.3 |
| 1976 | 20.1 |
| 1977 | 19.6 |
| 1978 | 19.2 |
| 1979 | 19 |
| 1980 | 18.6 |
| 1981 | 18.7 |
| 1982 | 18.4 |
| 1983 | 18.2 |
| 1984 | 17.9 |
| 1985 | 17.6 |
| 1986 | 17.4 |
| 1987 | 17.3 |
| 1988 | 17 |
| 1989 | 17 |
| 1990 | 17 |
| 1991 | 17.1 |
| 1992 | 17.2 |
| 1993 | 17.3 |
| 1994 | 17.1 |
| 1995 | 17.1 |
| 1996 | 16.9 |
| 1997 | 16.6 |
| 1998 | 16.3 |
| 1999 | 15.9 |
| 2000 | 15.9 |
| 2001 | 15.7 |
| 2002 | 15.7 |
| 2003 | 15.7 |
| 2004 | 15.5 |
| 2005 | 15.4 |
| 2006 | 15.3 |
| 2007 | 15.2 |
| 2008 | 15 |
| 2009 | 15 |
Pupil/teacher ratio
Sources:
nces.ed.gov
Share:

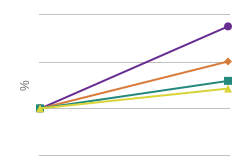
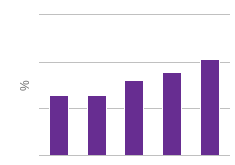
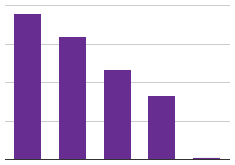
The pupil/teacher ratio for elementary and secondary schools in the U.S. has dropped from 22.4 in 1970 to 15.0 in 2009, indicating that there are more teachers available to provide personal attention to some students.