| United States | China | Germany | United Kingdom | Russia | |
|---|---|---|---|---|---|
| 2005 | 39 | 72 | 25 | 44 | 23 |
| 2006 | 29 | 81 | 29 | 35 | 32 |
| 2007 | 25 | 83 | 33 | 30 | 36 |
| 2008 | 23 | 86 | 34 | 30 | 54 |
| 2009 | 36 | 87 | 43 | 21 | 27 |
| 2010 | 30 | 87 | 39 | 31 | 34 |
| 2011 | 21 | 85 | 43 | 32 | 32 |
| 2012 | 29 | 82 | 53 | 30 | 46 |
| 2013 | 31 | 85 | 57 | 26 | 37 |
Percentage of National Population Who Are Satisfied With Direction
Sources:
pewglobal.org

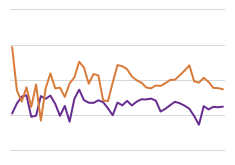
This chart shows a sampling of countries and their views before and after the great recession as to the direction of their countries economy. What does this chart say about economic optimism? What does it say about China? What does it say about the possible sampling methods used in China? Is this accurate? Data can be biased.