
| NYC | Chicago | |
|---|---|---|
| 1985 | 1384 | 666 |
| 1986 | 1582 | 744 |
| 1987 | 1672 | 687 |
| 1988 | 1896 | 660 |
| 1989 | 1905 | 742 |
| 1990 | 1905 | 742 |
| 1991 | 2154 | 925 |
| 1992 | 1995 | 939 |
| 1993 | 1946 | 845 |
| 1994 | 1564 | 928 |
| 1995 | 1177 | 824 |
| 1996 | 983 | 789 |
| 1997 | 770 | 757 |
| 1998 | 633 | 703 |
| 1999 | 664 | 641 |
| 2000 | 673 | 631 |
| 2001 | 714 | 666 |
| 2002 | 587 | 648 |
| 2003 | 597 | 598 |
| 2004 | 570 | 448 |
| 2005 | 539 | 448 |
| 2006 | 596 | 468 |
| 2007 | 496 | 443 |
| 2008 | 471 | 458 |
| 2009 | 471 | 458 |
| 2010 | 536 | 432 |
| 2011 | 515 | 431 |
| 2012 | 414 | 532 |
Year
Number of Homicides
Sources:
bjs.gov
Share:


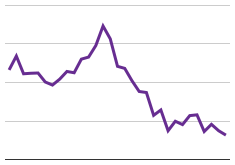

This data depicts the tale of two highly populated U.S. cities. With New York city population around 7-8 million residents in that 27 year span and Chicago lingering around 3 million residents, you can see the difference in the numbers of murders. New York city has more than twice the population of Chicago, but around the same number of murders.