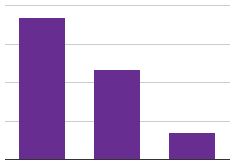
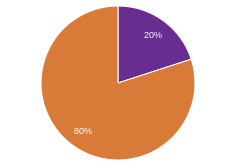
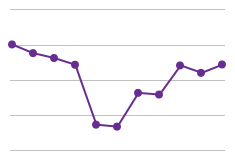
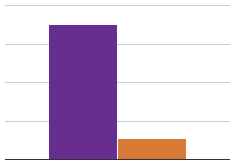
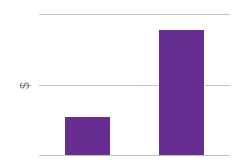
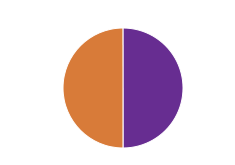
From 2009 to 2011, as the nation crawled down the road to economic recovery, not everyone faired evenly. The mean net worth of households in the upper 7% of the wealth ditribution rose by (28%), while those in the lower 93% saw their net worth drop by (4%).


From 2009 to 2011, as the nation crawled down the road to economic recovery, not everyone faired evenly. The mean net worth of households in the upper 7% of the wealth ditribution rose by (28%), while those in the lower 93% saw their net worth drop by (4%).