
Employment at Different Levels of Education as of 2015
by Melissa Adeva on Apr 14, 2015 | Views: 544 | Score: 2
| Less Than a High School Diploma | High School Graduates, No College | Some College or Associate Degree | Bachelor's Degree or Higher | |
|---|---|---|---|---|
| 11000 | 35000 | 37000 | 51000 |
Educational Level
Civilian Labor Force (In Thousands)
Sources:
bls.gov
Share:

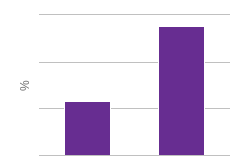
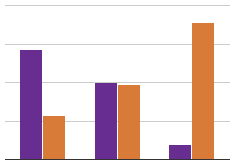
In this bar chart, you can see the amount of employment at the completion of different levels of education. These statistics involve people who range from ages 25 or older. According to this chart, the higher the level of education completed, the more likely you are to be in the labor force.
Nice chart, but I think your numbers are a bit off. I think you need to go back and add 3 zeros to each number. Always be aware of scale.
These are the numbers I found according to my source. My source stated the numbers they provided were in thousands.
Yes. That means you either have to say they are in thousands or you have to add three zeros to each number. In other words, your chart says there are 51,000 people in the labor force with a BA or higher. In fact there are 51,000,000. Hope this helps.
Okay, thank you for your help!
Okay, Mel. Good pickup, Noah.