Race and Full-Time Government Employment
by Alejandro Esquino Gomez on Apr 11, 2015 | Views: 128 | Score: 0
| Indian | Asian | Hispanic | Black | White | |
|---|---|---|---|---|---|
| 0.1 - 15.9 | 0.8 | 2.2 | 9.5 | 25.1 | 62.4 |
| 16.0 - 19.9 | 1 | 0.9 | 21 | 39.5 | 37.6 |
| 20.0 - 24.9 | 0.7 | 1 | 18.8 | 31.4 | 48.1 |
| 25.0 - 32.9 | 0.6 | 1.8 | 14.3 | 31.1 | 52.3 |
| 33.0 - 42.9 | 0.6 | 2.6 | 12.4 | 25.7 | 58.8 |
| 43.0 - 54.9 | 0.6 | 3.2 | 12.2 | 18.6 | 65.5 |
| 55.0 - 69.9 | 0.6 | 3.8 | 11.4 | 14.8 | 69.4 |
| 70.0 + | 0.5 | 5.7 | 11.7 | 11.2 | 71 |
| Total | 0.6 | 3.5 | 12.5 | 19.8 | 63.7 |
Race
Salary $k
%
Sources:
eeoc.gov

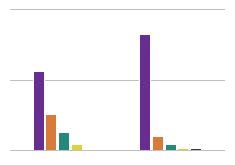
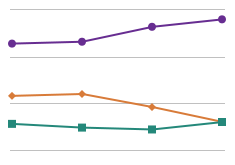
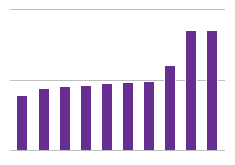

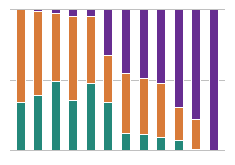
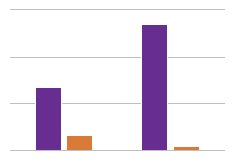
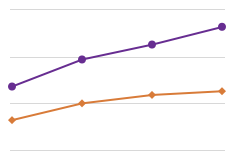
White people clearly make up a large percentage of full-time government employees. The only abnormality in that trend occurs with employees making $16.0-19.9K a year. For some reason here blacks account for a larger percentage of the workforce.