
| Females | Males | |
|---|---|---|
| FY 1997 | 88.4 | 11.6 |
| FY 1998 | 87.1 | 12.9 |
| FY 1999 | 87.9 | 12.1 |
| FY 2000 | 86.4 | 13.6 |
| FY 2001 | 86.3 | 13.7 |
| FY 2002 | 85.1 | 14.9 |
| FY 2003 | 85.3 | 14.7 |
| FY 2004 | 84.9 | 15.1 |
| FY 2005 | 85.7 | 14.3 |
| FY 2006 | 84.6 | 15.4 |
| FY 2007 | 84 | 16 |
| FY 2008 | 84.1 | 15.9 |
| FY 2009 | 84 | 16 |
| FY 2010 | 83.6 | 16.4 |
| FY 2011 | 83.7 | 16.3 |
% of Charges Filed By...
Sources:
eeoc.gov
Share:

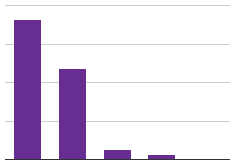
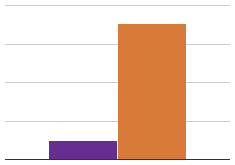
Since 1997, women have consistently outnumbered men in the number of sexual harassment charges they file each year.