| Energy | Metals | Other | Chemical Products | Machines | Wood Products | Aircraft & Cars | Precious Metals | |
|---|---|---|---|---|---|---|---|---|
| 2000 | 54 | 20 | 9.7 | 7.1 | 4.1 | 2.7 | 3.1 | 4.9 |
| 2001 | 45.7 | 17.3 | 16.4 | 6.8 | 4.9 | 2.8 | 3.7 | 3.4 |
| 2002 | 57.8 | 18.3 | 19.7 | 6.8 | 4.8 | 3.3 | 4.7 | 3.1 |
| 2003 | 72.7 | 22.5 | 24.3 | 8.5 | 5.4 | 3.8 | 5.4 | 5.4 |
| 2004 | 106 | 19.1 | 16.8 | 11.1 | 6.8 | 5 | 5.9 | 3.9 |
| 2005 | 160 | 40.2 | 14.4 | 13.3 | 6.9 | 6 | 4.3 | 5 |
| 2006 | 197 | 47.9 | 16.9 | 4.9 | 2.7 | 6.9 | 5 | 5.5 |
| 2007 | 224 | 56.1 | 23.1 | 18.6 | 9.9 | 9.2 | 6 | 5.7 |
| 2008 | 316 | 61.1 | 25.4 | 27.1 | 11.9 | 8.2 | 7.6 | 6.9 |
| 2009 | 198 | 34.7 | 22.2 | 15.9 | 8.9 | 5.8 | 3.6 | 3.8 |
| 2010 | 265 | 46.9 | 24.9 | 21.1 | 9.6 | 6.5 | 4.5 | 7.4 |
| 2011 | 359 | 50.3 | 33.1 | 27.7 | 12.4 | 7.7 | 5.6 | 2 |
| 2012 | 319 | 46.8 | 35.2 | 26.6 | 12.7 | 7.1 | 7.8 | 15.1 |
Value of exported goods (Billions of USD)
Sources:
rferl.org

 of
of


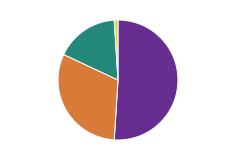
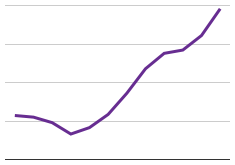
Since Putin took power in 2000, Russian exports have grown several times. Of course, most of this growth is concentrated in the energy sector due to Russian natural gas reserves, but given the incredible growth of the Russian export market under Putin, it's no wonder that Russian citizens have a lot of faith in their current leader.