US Support For Same-Sex Marriage By Age: 2013
by Kaitlin Senk on Jun 27, 2013 | Views: 150 | Score: 0
| Age Groups | |
|---|---|
| 18-29 | 70 |
| 30-49 | 53 |
| 50-64 | 46 |
| 65+ | 41 |
% of US public that believes same-sex marriage should be legal
Sources:
gallup.com
Share:


| Age Groups | |
|---|---|
| 18-29 | 70 |
| 30-49 | 53 |
| 50-64 | 46 |
| 65+ | 41 |
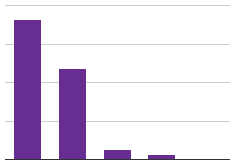
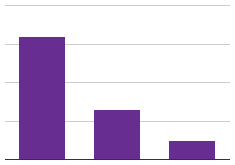
Support for same-sex marriage is highest among the 18-29 age group. Older Americans are still less likely to support legal same-sex marriage.