Demographics of US Public Judging Family Trends
by Kaitlin Senk on Jun 24, 2013 | Views: 52 | Score: 0
| Accept trends (believe they make no difference to society) | Skeptical of trends (tolerant but are concerned about the impact of these trends on society) | Reject trends (believe most trends are bad for society) | |
|---|---|---|---|
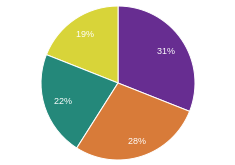
| Total Public Surveyed | 31 | 37 | 32 |
| Men | 26 | 39 | 34 |
| Women | 36 | 35 | 29 |
| White | 30 | 35 | 35 |
| Black | 27 | 45 | 28 |
| Hispanic | 42 | 42 | 17 |
| 18-29 | 39 | 46 | 16 |
| 30-49 | 33 | 36 | 31 |
| 50-64 | 30 | 36 | 35 |
| 65+ | 19 | 34 | 47 |
| Republican | 16 | 30 | 54 |
| Democrat | 39 | 44 | 17 |
| Independent | 32 | 38 | 31 |
% in each group that either accept/reject or are skeptical of trends
Sources:
pewsocialtrends.org

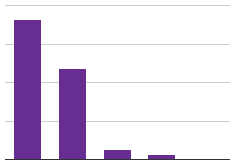
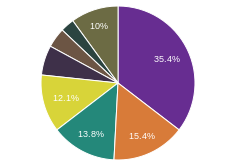
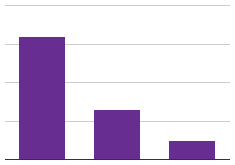
Women, Hispanics and young Americans tend to be more accepting of current family trends like children out of wedlock, gay and lesbian parenthood, single mother households, couples living together unmarried, mothers working outside home, interracial marriage and women not having children. White, older, male Republicans tend to reject these trends