
Yearly Per Capita Beverage Consumption in the U.S.
by kendramayer2017 on Oct 7, 2014 | Views: 135 | Score: 1
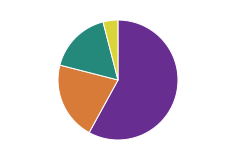
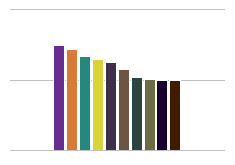
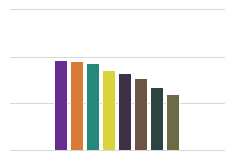
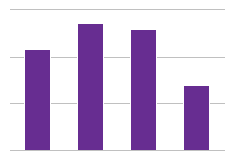
| Gallons of... Carbonated Soft Drinks | Bottled Water | Beer | Milk | Coffee | |
|---|---|---|---|---|---|
| 2005 | 51.5 | 25.4 | 21.4 | 21.2 | 18.8 |
| 2010 | 44.7 | 28.3 | 20.8 | 20.4 | 18.5 |
Sources:
adage.com
Share:

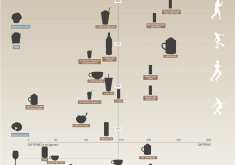
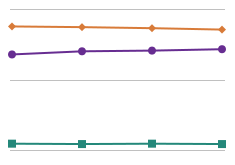
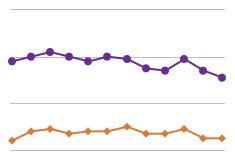
Looks like Americans still drink a lot of soda, but they were better off in 2010 than they were in 2005. In '05, Americans (per capita) drank over double the amount carbonated soft drinks as they did bottled water.