
| All Accidents | Fatal Accidents | |
|---|---|---|
| 1983 | 3.15 | 0.55 |
| 1984 | 1.96 | 0.12 |
| 1985 | 2.41 | 0.8 |
| 1986 | 2.31 | 0.2 |
| 1987 | 3.1 | 0.38 |
| 1988 | 2.6 | 0.18 |
| 1989 | 2.48 | 0.98 |
| 1990 | 1.98 | 0.49 |
| 1991 | 2.21 | 0.34 |
| 1992 | 1.46 | 0.32 |
| 1993 | 1.81 | 0.08 |
| 1994 | 1.68 | 0.3 |
| 1995 | 2.67 | 0.22 |
| 1996 | 2.69 | 0.36 |
| 1997 | 3.09 | 0.25 |
| 1998 | 2.97 | 0.06 |
| 1999 | 2.91 | 0.11 |
| 2000 | 3.06 | 0.16 |
| 2001 | 2.36 | 0.11 |
| 2002 | 2.37 | 0 |
| 2003 | 3.09 | 0.11 |
| 2004 | 1.59 | 0.11 |
| 2005 | 2.06 | 0.15 |
| 2006 | 1.71 | 0.1 |
| 2007 | 1.43 | 0.05 |
| 2008 | 1.47 | 0.1 |
| 2009 | 1.7 | 0.11 |
| 2010 | 1.63 | 0.06 |
| 2011 | 1.75 | 0 |
Accidents per 1,000,000 flight hours
Sources:
ntsb.gov
Share:

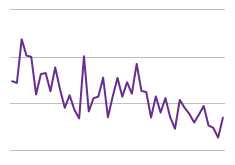
Airplane accident rates per 1,000,000 flight hours have remained relatively low since 2006. In 2011, there were no fatal accidents among scheduled and nonscheduled service airlines in the United States.