| purple bars | |
|---|---|
| 16-19 | 24 |
| 20-24 | 13.3 |
| 25-29 | 8.9 |
| 30-34 | 7.6 |
| 35-39 | 7 |
| 40-44 | 6.2 |
| 45-49 | 6.2 |
| 50-54 | 6.2 |
| 55-59 | 6 |
| 60-64 | 5.9 |
| 65-69 | 6.7 |
| 70-74 | 6.4 |
| 75 and older | 4.6 |
Percent of Group
Sources:
bls.gov
Share:


| purple bars | |
|---|---|
| 16-19 | 24 |
| 20-24 | 13.3 |
| 25-29 | 8.9 |
| 30-34 | 7.6 |
| 35-39 | 7 |
| 40-44 | 6.2 |
| 45-49 | 6.2 |
| 50-54 | 6.2 |
| 55-59 | 6 |
| 60-64 | 5.9 |
| 65-69 | 6.7 |
| 70-74 | 6.4 |
| 75 and older | 4.6 |
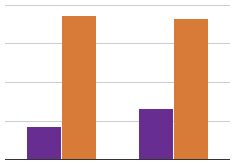
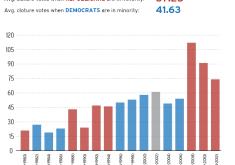
For the current population, it is clear that unemployment is endemic among the younger age groups of the population, particularly the 16-19 year old age group.