
| Total Government Spending | Total Government Revenue | |
|---|---|---|
| 1992 | 2079 | 1642 |
| 1993 | 2076 | 1700 |
| 1994 | 2109 | 1815 |
| 1995 | 2142 | 1910 |
| 1996 | 2164 | 2015 |
| 1997 | 2181 | 2152 |
| 1998 | 2226 | 2320 |
| 1999 | 2260 | 2426 |
| 2000 | 2325 | 2632 |
| 2001 | 2367 | 2530 |
| 2002 | 2515 | 2318 |
| 2003 | 2646 | 2183 |
| 2004 | 2731 | 2240 |
| 2005 | 2850 | 2483 |
| 2006 | 2965 | 2688 |
| 2007 | 2962 | 2787 |
| 2008 | 3168 | 2681 |
| 2009 | 3696 | 2212 |
| 2010 | 3590 | 2247 |
| 2011 | 3666 | 2344 |
| 2012 | 3563 | 2435 |
In Billions of Inflation Adjusted USD (2012)
Sources:
heritage.org, savvyroo.com
Share:

 of
of

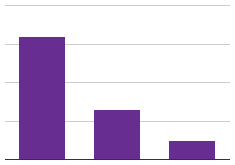
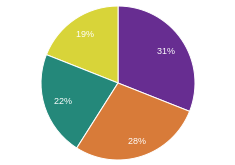
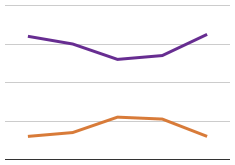
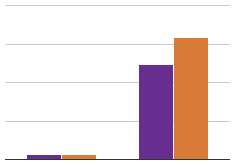
The increase in government spending and decrease in revenue has increased our national debt to over 16 trillion dollars. See how the government is spending our money by clicking the secondary source below.